Schlagwort-Archive: Highcharts

Highcharts ist eine JavaScript-Library zur dynamischen Erstellung von Diagrammen auf einer Webseite.

AirPi Wetterwerte Salzburg Stadt (kombiniert)


Die obigen Diagramme zeigen die mit AirPi v1.4 und Raspberry Pi ermittelten Wetterwerte und Umweltdaten wie Temperatur (°C), Relative Luftfeuchtigkeit (%), Luftdruck (hPa), Kohlenstoffmonoxid (CO), Stickstoffdioxid (NO2) und Helligkeit (Lux). Die Grafiken werden aus den Sensor-Daten dynamisch über die API von Xively.com und der JavaScript-Library Highcharts generiert.
Die dargestellten Werte wurden tlw. noch nicht mittels der Temperatur korrigiert und entsprechend in eine verbreitete Einheit umgerechnet! Zeiträume in denen keine Daten zur Verfügung stehen, werden als durchgehende Linien dargestellt.

Diagramm-Beispiele:

AirPi v1.4 mit Raspberry Pi (Model B) Wetterstation
Standort: Salzburg Stadt, Österreich
Latitude: 47.7672099412293
Longitude: 13.0753720089843
Höhe: 420 m ü. d. Meer, 7 m ü. d. Boden.

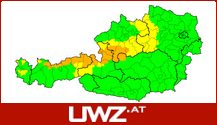
Aktuelle Unwetterwarnungen für Österreich

Liniendiagramm aus Xively-Daten mit Highcharts

Liniendiagramm 1

<script src="http//ajax.googleapis.com/ajax/libs/jquery/1.9.1/jquery.min.js"></script>
<script src="http://code.highcharts.com/stock/highstock.js"></script>

<div id="chart1" style="height: 300px;"></div>

<script>
jQuery(function() {
    feedid = '******';
    key = '******';
    channel = 'Air_Temperature';
    interval = 900;
    days = 7;

    start_date = new Date();
    start_date.setHours(start_date.getHours() - 24*days); 

    // load data from xively feed
	jQuery.getJSON('http://api.xively.com/v2/feeds/'+feedid+'/datastreams/'+channel+'.json?start='+start_date+'&interval='+interval+'?key='+key, function(data) {
        var xively_datapoints = data.datapoints;
        var chartdata = [];
        // convert data format from xively to highcharts
        for (i = 0; i < xively_datapoints.length; i++) {
            chartdata.push([
                Date.parse(xively_datapoints[i].at),
                parseFloat(xively_datapoints[i].value)
            ]);
        }

		// create the chart using highcharts line diagram
		jQuery('#chart1').highcharts('StockChart', {
			rangeSelector : { selected : 1 },
			 exporting: {
                    chartOptions:{
	                   yAxis: { labels: { style: { color: '#000', fontSize: '14px'} } }
		            }
             },
			series : [{
				name : channel,
				data : chartdata,
				tooltip: { valueDecimals: 2 }
			}]
		});
	});
});
</script>

Liniendiagramm 2


<script src="http//ajax.googleapis.com/ajax/libs/jquery/1.9.1/jquery.min.js"></script>
<script src="http://code.highcharts.com/stock/highstock.js"></script>

<div id="chart2" style="height: 300px;"></div>

<script>
jQuery(function() {
    feedid = '******';
    key = '*****';
    channel = 'Air_Temperature';
    interval = 900;
    days = 7;

    start_date = new Date();
    start_date.setHours(start_date.getHours() - 24*days); 

    // load data from xively feed
    jQuery.getJSON('http://api.xively.com/v2/feeds/'+feedid+'/datastreams/'+channel+'.json?start='+start_date+'&interval='+interval+'?key='+key, function(data) {
		var xively_datapoints = data.datapoints;
		var chartdata = [];
		// convert data format from xively to highcharts
		for (i = 0; i < xively_datapoints.length; i++) {
			chartdata.push([
				Date.parse(xively_datapoints[i].at),
				parseFloat(xively_datapoints[i].value)
			]);
		}
			// create the chart using highcharts line diagram
		jQuery('#chart2').highcharts({
			title: {
				text: 'Aktuelle Temperatur',
				x: -20
			},
			subtitle: {
				text: 'Quelle: Xively.com',
				x: -20
			},
                        xAxis: {
                          type: 'datetime',
                        },
			yAxis: {
				title: {
						text: 'Temperatur (C)',
				},
				plotLines: [{
						value: 0,
						width: 1,
						color: '#808080',
				}]
			},
			tooltip: {
				valueSuffix: 'C',
			},
			series: [{
				name: channel,
				data: chartdata,
				tooltip: { valueDecimals: 2 },
			}],
		});

	});
});

Anzeige von Xively-Daten mit Highcharts

Anzeige von Xively.com-Daten auf einer Webseite mit Hilfe von Highcharts und JQuery:

<script src="http://code.highcharts.com/highcharts.js"></script>
<script src="http://code.highcharts.com/highcharts-more.js"></script>
<script src="http://code.highcharts.com/modules/exporting.js"></script>

Temperatur-Anzeige

<script>
jQuery( document ).ready(function( $ ) {
    var feedid = "*****";
    var key = "*****";
    
    // Air Temperature
    $('#chart_air_temperature').highcharts({
        chart: {
            type: 'gauge',
            alignTicks: false,
            plotBackgroundColor: null,
            plotBackgroundImage: null,
            plotBorderWidth: 0,
            plotShadow: false,
        },
        title: { text: 'Air Temperature' },
        pane: { startAngle: -150, endAngle: 150 },            
        yAxis: [{
            min: -20, max: 60,
            tickPosition: 'outside',
            minorTickPosition: 'outside',
            lineColor: '#339', tickColor: '#339', minorTickColor: '#339',
            offset: -20,
            labels: { distance: 12, rotation: 'auto' },
            tickLength: 5, minorTickLength: 5, lineWidth: 2,
            endOnTick: true,
            plotBands: [
                { color: 'lightblue', from: -20, to: 0, innerRadius: '30%', outerRadius: '40%' },
                { color: 'lightgreen', from: 18, to: 25, innerRadius: '30%', outerRadius: '40%' },
                { color: '#ff9999', from: 38, to: 60, innerRadius: '30%', outerRadius: '40%' }],
        }, {
            min: -20 * 1.8 + 32, max: 60 * 1.8 + 32,
            lineColor: '#933', tickColor: '#933', minorTickColor: '#933',
            tickLength: 5, minorTickLength: 5, lineWidth: 2,
            labels: { distance: -20, rotation: 'auto' },
            offset: -30,
            endOnTick: false,
        }],
        series: [{
            name: 'Air_Temperature',
            data: [0], // start value
            dataLabels: {
                formatter: function () {
                    var c = this.y;
                    var f = c * 1.8 + 32;
                    return ''+c+'C/'+f+'F';
                },
                backgroundColor: {
                    linearGradient: { x1: 0, y1: 0, x2: 0, y2: 1 },
                    stops: [ [0, '#DDD'], [1, '#FFF'] ]
                }
            },
            tooltip: { valueSuffix: 'C' }
        }]
    
    },
    function(chart) {
        setInterval(function() {
            $.getJSON('http://api.xively.com/v2/feeds/'+feedid+'/datastreams/Air_Temperature.json?key='+key, function(data) {
                var value = Math.round(data.current_value);
                var point = chart.series[0].points[0];
                point.update(value);
             });
        }, 3000);
    });
});
</script>

Anzeige der Lautstärke

<script>
jQuery( document ).ready(function( $ ) {
    var feedid = "*****";
    var key = "*****";

    
    // Volume
    $('#chart_volume').highcharts({
        chart: {
            type: 'gauge',
            plotBorderWidth: 1,
            plotBackgroundColor: {
                linearGradient: { x1: 0, y1: 0,  x2: 0, y2: 1 },
                stops: [ [0, '#FFF4C6'], [0.3, '#FFFFFF'], [1, '#FFF4C6'] ]
            },
            plotBackgroundImage: null,
            height: 200
        },
        title: { text: 'VU meter' },
        pane: [{
            startAngle: -45, endAngle: 45,
            background: null,
            center: ['50%', '145%'],
            size: 300
        }],                       
        yAxis: [{
            min: -20,
            max: 1000,
            minorTickPosition: 'outside',
            tickPosition: 'outside',
            labels: {
                rotation: 'auto',
                distance: 20
            },
            plotBands: [{
                color: '#C02316', from: 500, to: 1000,
                innerRadius: '100%', outerRadius: '105%'
            }],
            pane: 0,
            title: {
                text: 'VU Mono',
                y: -40
            }
        },],  
        plotOptions: {
            gauge: {
                dataLabels: {
                    enabled: false
                },
                dial: {
                    radius: '100%'
                }
            }
        },
        series: [{
            data: [-20],
            yAxis: 0
        }]
    
    },
    
    // Let the music play
    function(chart) {
        setInterval(function() {
            $.getJSON('http://api.xively.com/v2/feeds/'+feedid+'/datastreams/Volume.json?key='+key, function(data) {
                var value = Math.round(data.current_value);
                // console.log(value);
                var point = chart.series[0].points[0];
                point.update(value, false);
                chart.redraw();
            });
        }, 500);
        
    });
});
</script>