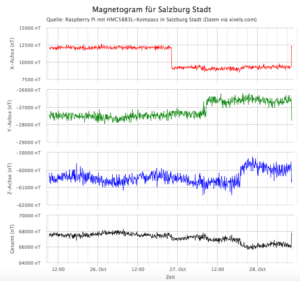
Die Diagramme (Magentogram) zeigen die Stärke des Erdmagnetfeldes in der X-, Y- und Z-Achse in Miligauss (1 mGa = 0.001 Ga), die Gesamtfeldstärke des Erdmagnetfeldes in mGa sowie die Ausrichtung des Kompass in Grad. Da das Kompass-Modul noch nicht fix montiert ist, können sich die Werte bei Positionsänderungen spunghaft ändern.
Kombiniertes Magnetogram
Die Feldstärken, werden mit dem 3-Achsen Kompass-Modul HMC5883L von Adafruit mit Hilfe eines Raspberry Pi (Model B) ausgelesen. Die Grafiken werden aus den Sensor-Daten dynamisch über die API von Xively.com und der JavaScript-Library Highcharts generiert. Xively.com Dashboard: https://xively.com/feeds/115042809
Anschluss des HMC5883L über GPIO des Raspberry-Pi:
| Raspberry Pi (B) | HMC5883L | |
| 1. | 3.3V | VCC |
| 2. | GND | GND |
| 3. | SDA | SDA |
| 4. | SCL | SCL |

Nachfolgend der Python-Quellcode zum Auslesen der 3-Achsen Kompass HMC5883L. Zum einfachen Auslesen, wird i2clibraries verwendet.
#!/usr/bin/env python3

import time
import math
import requests
import json
from i2clibraries import i2c_hmc5883l

port = 1              # i2c port: 0...Model A or 1...Model B and B+
adr = 0x1e            # address for compass (fixed: 0x1e)
scale = 8.1           # scale: 0.88, 1.3 (default), 1.9, 2.5, 4.0, 4.7, 5.6, 8.1 Gauss (e.g. 1.3 G = 0.00013T = 130000 nT)

xively_url    = "https://api.xively.com/v2/feeds/"
xively_feedid = "***get_from_xively.com***"
xively_key    = "***get_from_xively.com***"

declination_deg = 2   # magnetic declination from http://magnetic-declination.com (degree)
declination_min = 56  # magnetic declination from http://magnetic-declination.com (minutes)# inclination: 63° 57', field strength 48255.9 nT

compass = i2c_hmc5883l.i2c_hmc5883l(port, adr, scale) # init hmc5883l
compass.setContinuousMode()
compass.setDeclination(declination_deg, declination_min) # set declination
time.sleep(0.5) # wait for changes

while 1:
  (x, y, z) = compass.getAxes() # read x, y, z values in mGa
  (deg, min) = compass.getHeading() # get heading in deg and min
  heading = round(deg + min / 60, 2)
  strength_gauss = round(math.sqrt(x * x + y * y + z * z), 2) # calculate magnetic field strength using the euclidean distance function
  strength_tesla = math.floor(strength_gauss * 100)

  print("Heading: ",deg,"° ",min, "'", sep="")
  print("Values:", x, y, z)
  print("Strength:", strength_tesla, "nT", strength_gauss, "mGa")
  data = []
  data.append({"id":"Compass_heading", "current_value":str(heading)})
  data.append({"id":"Compass_field",   "current_value":str(strength_gauss)})
  data.append({"id":"Compass_field_x", "current_value":str(x)})
  data.append({"id":"Compass_field_y", "current_value":str(y)})
  data.append({"id":"Compass_field_z", "current_value":str(z)})
  xively_body = {"version":"1.0.0", "datastreams":data}
  xively_json = json.dumps(xively_body)
  res = requests.put(xively_url+xively_feedid+".json", headers={"X-ApiKey":xively_key}, data=xively_json)
  time.sleep(15)
Die ausgelesenen Erdmagnetfeld-Werte sind derzeit noch unkalibriert. Außerdem wäre die autom. Wahl der Skala für den Sensors wünschenswert, um auch kleinere Änderungen im Magnetogram zu erfassen.
Beispiel Magentogram:

Quellen:
- https://learn.adafruit.com/adafruit-hmc5883l-breakout-triple-axis-magnetometer-compass-sensor/overview
- http://de.wikipedia.org/wiki/Erdmagnetfeld
- http://magnetic-declination.com/
- http://think-bowl.com/raspberry-pi/i2c-python-library-3-axis-digital-compass-hmc5883l-with-the-raspberry-pi/
- http://blog.bitify.co.uk/2013/11/connecting-and-calibrating-hmc5883l.html
- http://www.convertworld.com/de/magnetische-flussdichte/Gauss.html
