Anzeige von Xively-Daten mit Google Charts

Anzeige von Xively-Daten mit Hilfe von Google-Charts „Gauge“:

<script src="https://www.google.com/jsapi?ext.js"></script>

<script>
var feedid = "*****";
var key = "*****";
var chart_data;

google.load('visualization', '1', {packages:['gauge']});
google.setOnLoadCallback(initChart);

function loadData(chart, options, channel_name) {
    var p;     // variable for the data point
    jQuery.getJSON('https://api.xively.com/v2/feeds/'+feedid+'/datastreams/'+channel_name+'.json?&key='+key+'&callback=?', function(data) {
        p = data.current_value;
        if (p) {
            console.log(channel_name+': '+p);
            console.log(data);
            p = (p/1);
            chart_data.setValue(0, 0, data.unit.symbol);
            // chart_data.setValue(0, 0, channel_name);
            chart_data.setValue(0, 1, p);
            console.log(chart_data);
            chart.draw(chart_data, options);
        }
    });
}

function initChart() {
    chart_data = new google.visualization.DataTable();
    chart_data.addColumn('string', 'Label');
    chart_data.addColumn('number', 'Value');
    chart_data.addRows(1);

    // Air_Temperature
    chart_air_temperature = new google.visualization.Gauge(document.getElementById('chart_air_temperature'));
    options = {
        width: 200, height: 200,
        redColor: 'lightblue', redFrom: -20, redTo: 0,
        yellowColor: 'lightred', yellowFrom: 40, yellowTo: 60,
        greenColor: 'lightgreen', greenFrom: 18, greenTo: 25,
        min: -20, max: 60,
        majorTicks: [-20, -10, "0", 10, 20, 30, 40, 50, 60],
        minorTicks: 10,
        animation: {duration: 400, easing: 'out',},
    };
    loadData(chart_air_temperature, options, 'Air_Temperature');
    setInterval(function() { loadData(chart_air_temperature, options, 'Air_Temperature'); }, 15000);

    // Relative_Humidity
    chart_relative_humidity = new google.visualization.Gauge(document.getElementById('chart_relative_humidity'));
    options2 = {
        width: 200, height: 200,
        yellowColor: 'lightblue', yellowFrom: 0, yellowTo: 40,
        greenColor: 'lightgreen', greenFrom: 40, greenTo: 70,
        redColor: 'lightred', redFrom: 70, redTo: 100,
        min: 0, max: 100,
        majorTicks: ["0", 10, 20, 30, 40, 50, 60, 70, 80, 90, 100],
        minorTicks: 5,
        animation: {duration: 400, easing: 'out',},
    };
    loadData(chart_relative_humidity, options2, 'Relative_Humidity');
    setInterval(function() { loadData(chart_relative_humidity, options2, 'Relative_Humidity'); }, 15000);
}
</script>

Anzeige von Xively-Daten mit Highcharts

Anzeige von Xively.com-Daten auf einer Webseite mit Hilfe von Highcharts und JQuery:

<script src="http://code.highcharts.com/highcharts.js"></script>
<script src="http://code.highcharts.com/highcharts-more.js"></script>
<script src="http://code.highcharts.com/modules/exporting.js"></script>

Temperatur-Anzeige

<script>
jQuery( document ).ready(function( $ ) {
    var feedid = "*****";
    var key = "*****";
    
    // Air Temperature
    $('#chart_air_temperature').highcharts({
        chart: {
            type: 'gauge',
            alignTicks: false,
            plotBackgroundColor: null,
            plotBackgroundImage: null,
            plotBorderWidth: 0,
            plotShadow: false,
        },
        title: { text: 'Air Temperature' },
        pane: { startAngle: -150, endAngle: 150 },            
        yAxis: [{
            min: -20, max: 60,
            tickPosition: 'outside',
            minorTickPosition: 'outside',
            lineColor: '#339', tickColor: '#339', minorTickColor: '#339',
            offset: -20,
            labels: { distance: 12, rotation: 'auto' },
            tickLength: 5, minorTickLength: 5, lineWidth: 2,
            endOnTick: true,
            plotBands: [
                { color: 'lightblue', from: -20, to: 0, innerRadius: '30%', outerRadius: '40%' },
                { color: 'lightgreen', from: 18, to: 25, innerRadius: '30%', outerRadius: '40%' },
                { color: '#ff9999', from: 38, to: 60, innerRadius: '30%', outerRadius: '40%' }],
        }, {
            min: -20 * 1.8 + 32, max: 60 * 1.8 + 32,
            lineColor: '#933', tickColor: '#933', minorTickColor: '#933',
            tickLength: 5, minorTickLength: 5, lineWidth: 2,
            labels: { distance: -20, rotation: 'auto' },
            offset: -30,
            endOnTick: false,
        }],
        series: [{
            name: 'Air_Temperature',
            data: [0], // start value
            dataLabels: {
                formatter: function () {
                    var c = this.y;
                    var f = c * 1.8 + 32;
                    return ''+c+'C/'+f+'F';
                },
                backgroundColor: {
                    linearGradient: { x1: 0, y1: 0, x2: 0, y2: 1 },
                    stops: [ [0, '#DDD'], [1, '#FFF'] ]
                }
            },
            tooltip: { valueSuffix: 'C' }
        }]
    
    },
    function(chart) {
        setInterval(function() {
            $.getJSON('http://api.xively.com/v2/feeds/'+feedid+'/datastreams/Air_Temperature.json?key='+key, function(data) {
                var value = Math.round(data.current_value);
                var point = chart.series[0].points[0];
                point.update(value);
             });
        }, 3000);
    });
});
</script>

Anzeige der Lautstärke

<script>
jQuery( document ).ready(function( $ ) {
    var feedid = "*****";
    var key = "*****";

    
    // Volume
    $('#chart_volume').highcharts({
        chart: {
            type: 'gauge',
            plotBorderWidth: 1,
            plotBackgroundColor: {
                linearGradient: { x1: 0, y1: 0,  x2: 0, y2: 1 },
                stops: [ [0, '#FFF4C6'], [0.3, '#FFFFFF'], [1, '#FFF4C6'] ]
            },
            plotBackgroundImage: null,
            height: 200
        },
        title: { text: 'VU meter' },
        pane: [{
            startAngle: -45, endAngle: 45,
            background: null,
            center: ['50%', '145%'],
            size: 300
        }],                       
        yAxis: [{
            min: -20,
            max: 1000,
            minorTickPosition: 'outside',
            tickPosition: 'outside',
            labels: {
                rotation: 'auto',
                distance: 20
            },
            plotBands: [{
                color: '#C02316', from: 500, to: 1000,
                innerRadius: '100%', outerRadius: '105%'
            }],
            pane: 0,
            title: {
                text: 'VU Mono',
                y: -40
            }
        },],  
        plotOptions: {
            gauge: {
                dataLabels: {
                    enabled: false
                },
                dial: {
                    radius: '100%'
                }
            }
        },
        series: [{
            data: [-20],
            yAxis: 0
        }]
    
    },
    
    // Let the music play
    function(chart) {
        setInterval(function() {
            $.getJSON('http://api.xively.com/v2/feeds/'+feedid+'/datastreams/Volume.json?key='+key, function(data) {
                var value = Math.round(data.current_value);
                // console.log(value);
                var point = chart.series[0].points[0];
                point.update(value, false);
                chart.redraw();
            });
        }, 500);
        
    });
});
</script>

Raspberry Pi Webcam

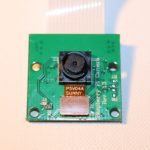
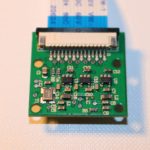
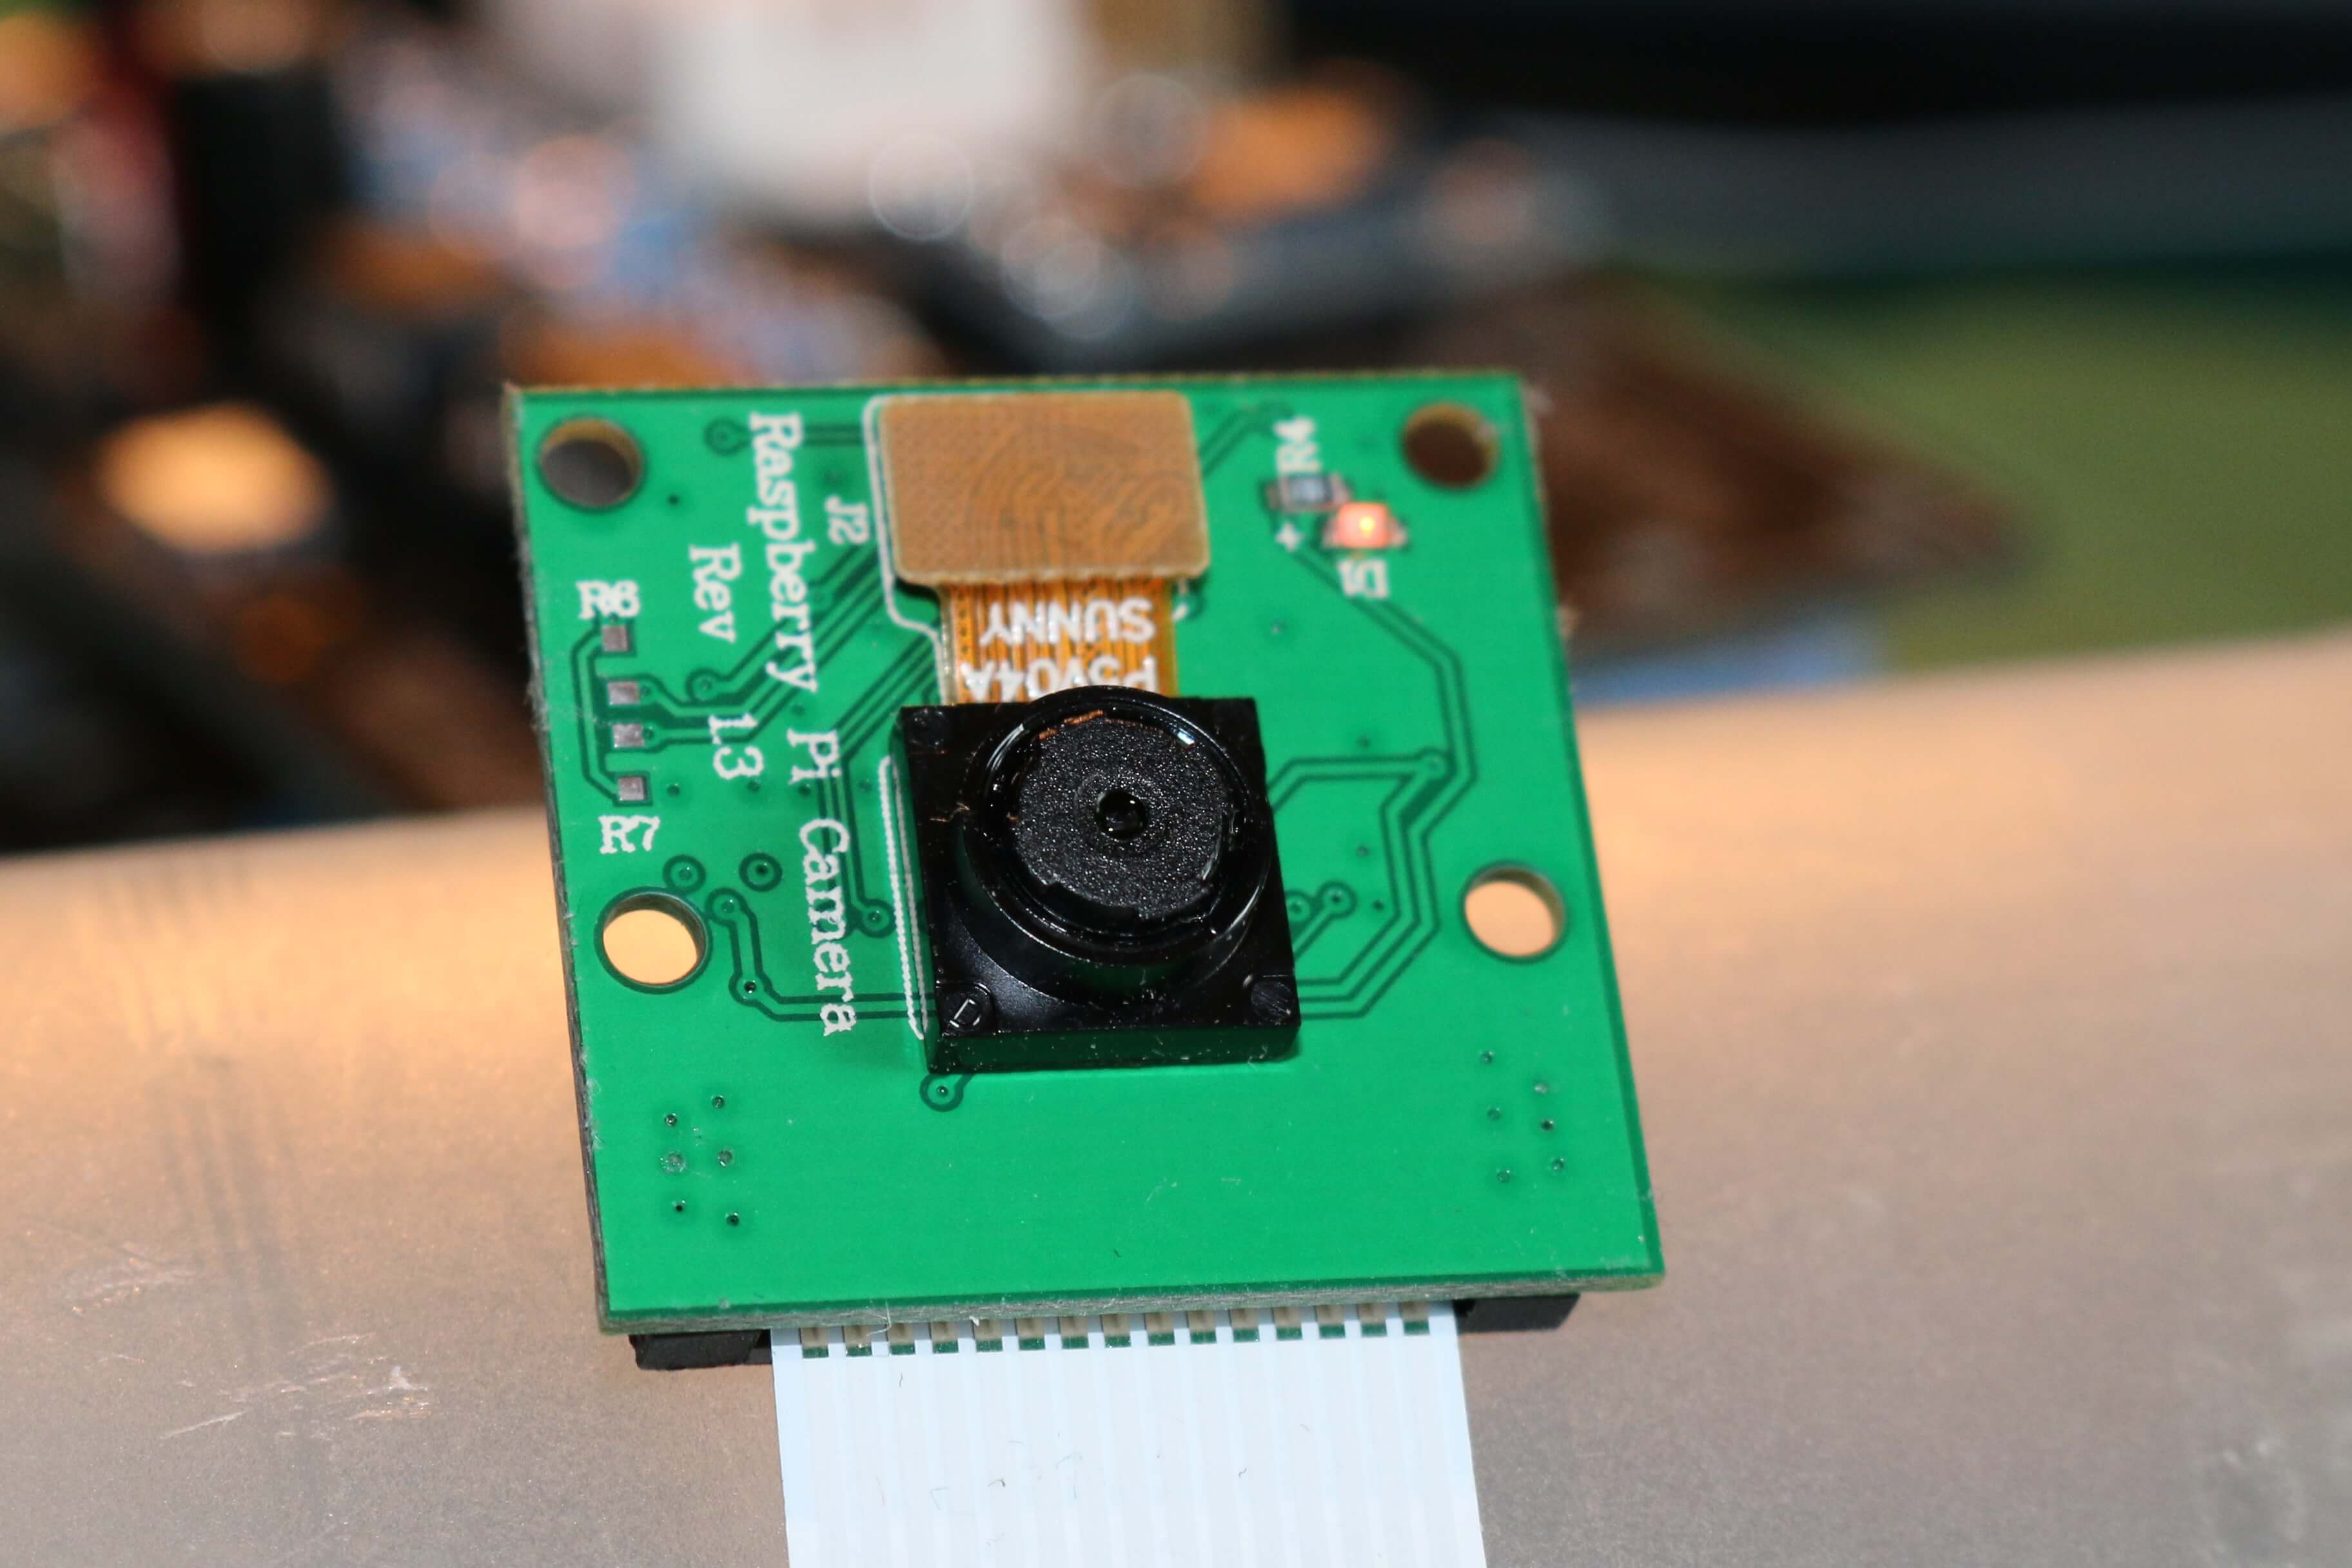
Die Raspberry Pi Webcam ist eine kleine 5M Pixel HD-Kamera, die auf einer kleinen Zusatzplatine geliefert wird und über ein Flachbandkabel an die CSI Schnittstelle des Raspberry Pi angeschlossen wird.

IMG_1236
IMG_1235

Technische Daten

  • 5MP Omnivision 5647 Camera Modul
  • Kompatibilität zu Raspberry Pi Model A und Model B
  • Fotoauflösung: 2592 x 1944 p
  • 1080p HD Videoaufnahme @ 30fps, 720p @ 60fps und 640x480p @60/90
  • Anschluss: 15-pin MIPI Camera Serial Interface (CSI)
  • Abmessungen: 12,2 x 9,4 x 3 cm
  • Gewicht: 18 g
  • Preis: ca 20,- EUR (Pi-Cam bei Amazon*)
  • Alternative: NoIR Pi-Cam ohne IR-Filter für Nachtaufnahmen (NoIR-Cam bei Amazon*)
Raspberry Pi Webcam weiterlesen

Raspberry Pi Display

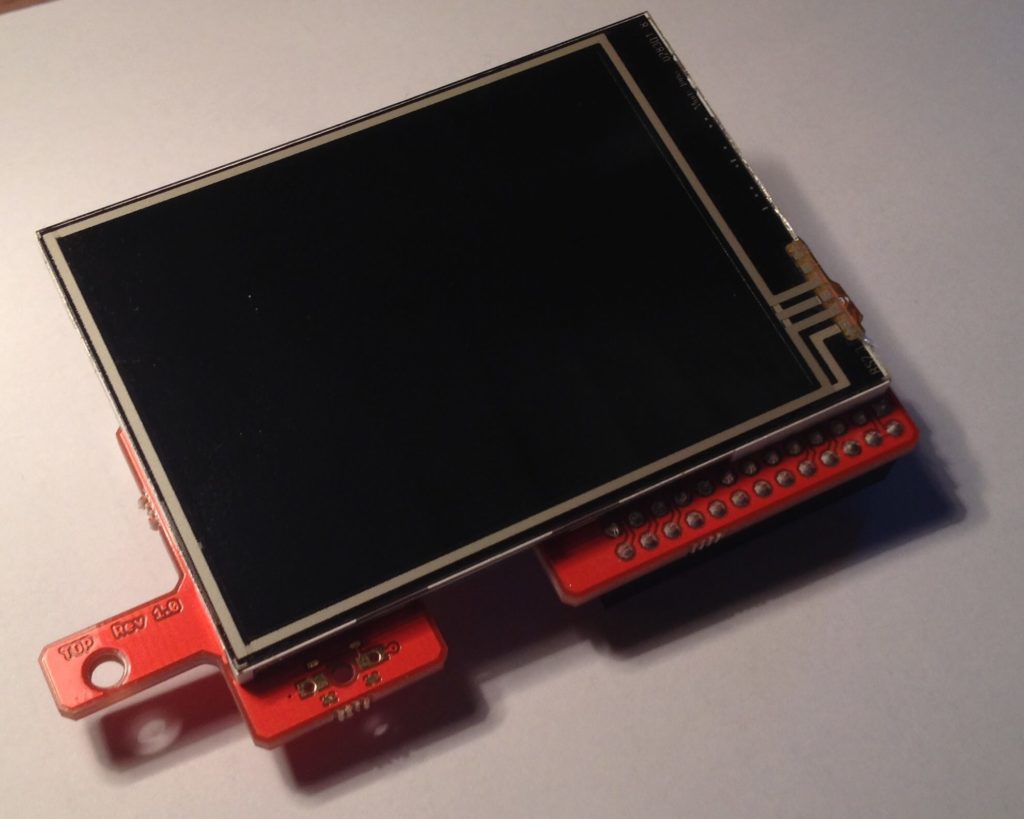
Von Watterott ist ein kleines 2.83″ Farb-Touch-Display erhältlich, das einfachen auf den GPIO-Port eines Raspberry Pi’s aufgesteckt werden kann. Das Display verwendet weder den HDMI-Port noch muss es extra programmiert werden – es verwendet den Raspberry PI Framebuffer und kann daher die Konsole oder auch X darstellen. Die X-Öberfläche lässt sich auch mit der Touch-Oberfläche bedienen.

RPi-Display von Watterott

Technische Daten des RPi Display von Watterott

  • Revision: 1.0
  • Größe: 2.83″ (43.2 x 57.6mm)
  • Typ: TFT Transmission
  • Auflösung: 320×240 Pixel
  • Farben: 262 K
  • Hintergrundbeleuchtung: 4 LED (dimmbar, PWM)
  • Touch Controller: TI ADS7846
  • Schnittstelle: SPI (Touch Controller + Display)
  • Stromversorgung: 3.3-5V (über GPIO)
  • Abmessungen: 50.2 x 69.3mm
  • Preis: ca 30,- EUR (RPi-Display bei Amazon.de*)

Webseite: http://www.watterott.com/de/RPi-Display
GIT-Repository: http://github.com/watterott/RPi-Display

Raspberry Pi Display weiterlesen